Share
The emergence of SQL-on-Hadoop technologies has been a major step forward for big data analysis, as it has opened up the Hadoop framework to a whole new set of users who are now able to apply their SQL knowledge to large data sets in a low-cost, high-performance distributed environment.
Before SQL-on-Hadoop, users needed the technical skills to work with the engine’s API in order to consume and study the data. But by leveraging SQL-on-Hadoop engines, organizations can now integrate reporting or analytical tools to simplify data study for their business users. These users also want an interactive business intelligence (BI) experience, and so demand a technology that allows them to quickly extract information through capabilities such as flexible reporting and fast data drill-downs.
However, finding a SQL-on-Hadoop solution that supports an interactive BI experience is still a challenge enterprises face today. So, in this article, we discuss the pros and cons of some of the solutions currently available on the market, to help you find the right tools to suit your own individual needs.
Hive on Hadoop
One of the most common layers that are being used on Hadoop is Hive. Hive, a contribution by Facebook to the open source world, is a framework that on the one hand gives an SQL-style (HQL) interface for writing queries, and on the other hand translates those queries to MapReduce jobs which Hadoop understands. Hive is commonly used by virtue of being one of the first of its kind to gain widespread adoption. The ability to understand SQL and be reached through an ODBC/JDBC connection meant developers could use their existing knowledge, quickly implement the solution and quickly deliver access to data on Hadoop.
However, Hive is far from being the best fit. A MapReduce job is slow and takes time (sometimes forever) to complete. It scans all the data and isn’t nearly fast enough to deliver the response time needed. Hive should be used for batch jobs and heavy processing but not for the fast response times required by interactive BI usage.
While it is not designed for interactive BI solutions it can be radically improved by preparing the data behind it in a way that is more suitable for Hadoop so even other frameworks can boost up performance.
Partitions
Hadoop is a distributed file system (HDFS) and as such everything on it is stored in files. When a Hive query runs, it gets translated to a MapReduce job, which opens the files and reads their content in a key value matter. Hive also holds a repository, a meta store, which defines every folder on HDFS as a table, every subfolder as a partition and every file as the content of the table. If a huge table needs to be scanned, Hadoop will split the files that need to be read along the number of processing units available in your Hadoop cluster.
If you can reduce the number of files by splitting them into subfolders (partitions) the query will finish sooner. So if a year partition is defined and the query needs to run for 2016 exclusively then only the files in that folder will be read and therefore the query will finish more quickly.
File Formats
Since data is stored in files, the format that is chosen plays a significant role performance wise. There are various types of file and each one has it pros and cons, but the most interesting formats that were designed specifically for analytical use are the ones we should consider. Parquet files, from the house of Cloudera, or ORC, from the house of HortonWorks, are such examples. Those files hold many key features that make them a good fit for analytics.
- Columnar storage - Databases traditionally store information in rows and are optimized for working with one record at a time. Columnar storage systems serialize and store data by column, meaning that searches across large data sets and reads of large data sets can be highly optimized.
- Compression - Per-column data compression further accelerates performance.
- Splittable - The ability to start reading and processing data at any point within a file. This will allow distribution of the load among the servers in the cluster and take advantage of the entire cluster processing power.
- Predicate push-down - One of the most expensive parts of reading and writing data is (de)serialization. Parquet supports predicate push-down to target specific columns in your data for filtering and reading, keeping the cost of deserialization to a minimum.
- Metadata - Parquet files hold some important metadata such as row count and some basic summary functions. So when a file needs to be scanned, if the data can be found in the metadata then it will be taken from there, allowing for greater speed (since the file doesn’t need to be scanned at all—only the metadata).
> Hive use cases: Batch processing, heavy lifting and ETLs. Since it supports many data formats it can still be used (with BI tools) when a specific format is needed and other solutions lack the support.
Impala on Hadoop
Hive was indeed the first layer that was adopted by BI tools. But, as discussed, it isn’t a great fit for users with interactive BI needs. A different yet better fit is a framework called Impala.
Impala is a massively parallel processing (MPP) engine on top of HDFS (not only Hadoop). It simply has daemons running on all your nodes, which cache some of the data that is in HDFS, so that these daemons can return data quickly without having to go through a whole MapReduce job. The reason for this is that there is a certain overhead involved in running a MapReduce job, so by bypassing MapReduce altogether you can get some pretty big gain in runtime.
Thus by using the right formats and partitions for the underlying data and utilizing Impala as your SQL tool on top of HDFS, you are starting to get close to our objective of interactive BI on big data.
Impala delivers the feel of running on a relational DB (since it is fast) while we are actually analyzing our big data, which is stored as files (i.e. Parquet files) in our HDFS.
But the problem is that, for every new object a user drags to their view, a query is generated and transferred to Impala which queries the files on HDFS and returns an answer to the BI tool that’s in charge of the visualization. Those kinds of operations just won’t run fast enough. The user will need to wait a few seconds from one click to another, which can be quite irritating. Think about it this way. Let’s say you want to show a measure for a set of dimensions and then decide you want to add or eliminate a few more measures. Between every one of those actions you will need to wait a few seconds till you get a response which might result in a poor end user experience.
> Impala use case: Query Parquet formatted files with high performance while you are working with Cloudera’s stack.
Indexes on Hadoop
Unlike MPP architecture that enables applications to search the whole database in parallel, the index approach only scans the relevant rows to extract at the same results.
Jethro Acceleration Engine is a good example of a tool that leverages the index approach in order to get that interactive BI feel we are after. Because indexes eliminate the need for full data scanning, queries are executed far more quickly. Since BI users usually start with a first view of the data set and then drill down to the most detailed and filtered (and therefore relatively small output) the index approach can work very well.
What makes Jethro special in the big data arena is the ability to index every field in the data set while working with a columnar store. This combination of a highly compressed columnar store (similar to the Parquet concept) and column-based indexes is particularly well suited to interactive BI. In addition, any queries that have been executed are stored in cache, thereby reducing response time even further for recurring queries. Furthermore dynamic aggregation takes place in the background in a seamless process according to query relevancy. So if the same query is often repeated then Jethro will create a pre-aggregated result for this in advance.
> Jethro use case: If interactive BI over Hadoop is what you’re seeking and row-level data is something you want to present then Jethro can be a good solution for you.
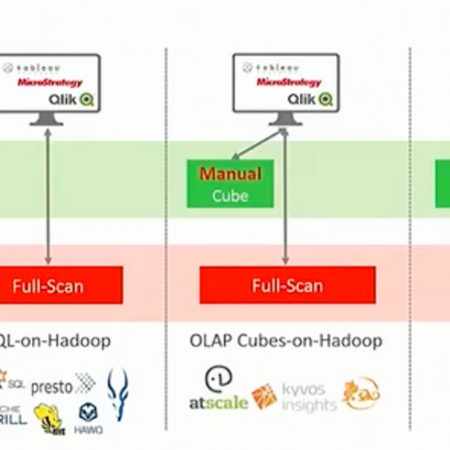
Cubes on Hadoop
An OLAP cube is a method of holding all the different dimensions, measures and hierarchies up front. Processing of the cube usually takes place at night and once done all kinds of calculation are available in advance. So once the BI tool queries the cube it just needs to locate the result, thereby limiting the query response time and making it a fast and interactive one.
Apache Kylin is an open source OLAP project that was contributed by eBay engineers in 2014. Running on top of the Hadoop data repository, the distributed analytic engine allowed eBay to execute sub-second queries on billions of rows of data.
Cubes started to be a pain as data grew and the overnight execution started to take too long. In order to speed up execution time organizations needed to scale up and add some expensive hardware. This initially made the cube less relevant for big data use. However, with the evolution of distributed systems and the cloud we can now also scale out and spread the load across more machines.
OLAP cube use case: Since all measures get pre-aggregated by all levels and categories in the dimension, it is highly suitable for interactivity and fast response time. Use this approach if you don’t need to present single data rows, but only summary views. If this approach is taken then the computational burden of overnight job processing should be considered.
Modern BI Tools Approach
Because their customers were increasingly experiencing performance issues, BI technology providers had to introduce their own fix to the slow query issue. One such example is Tableau, which offers a data extract feature. Tableau data extract is a compressed snapshot of data stored on your local BI server disk and loaded into memory as required to render a Tableau visualization. So instead of taking a complete round trip to the database, in this case HDFS, every action triggers a query that scans a file located on the local server and a part of it is even cached. So instead of waiting a few seconds from one action to the other, suddenly you have near immediate response times for actions.
This approach actually gives you an interactive dashboard with fast response times that serve our goal. However, this approach isn’t tenable when dealing with big data, since you can’t load all the required data. You can take only part of it, or aggregate it to a best fit, but neither allows full access to all your big data.
Advanced BI tools use case: When you need interactive BI on a relatively small data set. This is also a good solution when you only need a summarized view.